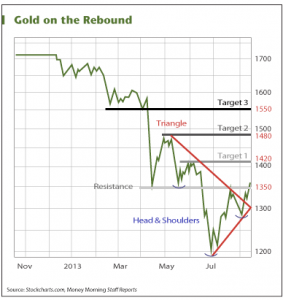
Summary: Technical analysis of gold charts from 2013 shows the rough time its had in the last 9 months, but that it may be starting to break for the upside once again. For first time since mid-April, the metal broke through a key barrier of $1350 per ounce. Much of this had to do with jitters in the stock market. Analyst Peter Krouch (MoneyMorning) explains that if gold can rise above and stay at $1350, that will for all intents and purposes be the new support level. At the end of June, gold slipped to just below $1200. Despite talk of the Fed tapering its stimulus program(s), plenty of other factors like high demand (both physical investing and consumer demand) and money printing by other central banks will support the metal in the months ahead bulls claim. Read more…
Gold Bugs Will Love What This Chart Says About Gold Prices
August 20, 2013 by
